Current Industry Multiples 2026: Revenue Multiples, EBIT Multiples, and EBITDA Multiples for company valuation for various countries and industries. Based on NIMBO’s unique data set of over a thousand recently observed purchase offers.
Last data update: April 8, 2026
On this page: NIMBO surveys thousands of small and medium-sized companies every month for received purchase offers and calculates EBIT Multiples, EBITDA Multiples, and Revenue Multiples from them. This gives NIMBO the most up-to-date database of valuation multiples. We publish these multiples every month for individual countries. More information on valuation multiples and how to use them can be found below.
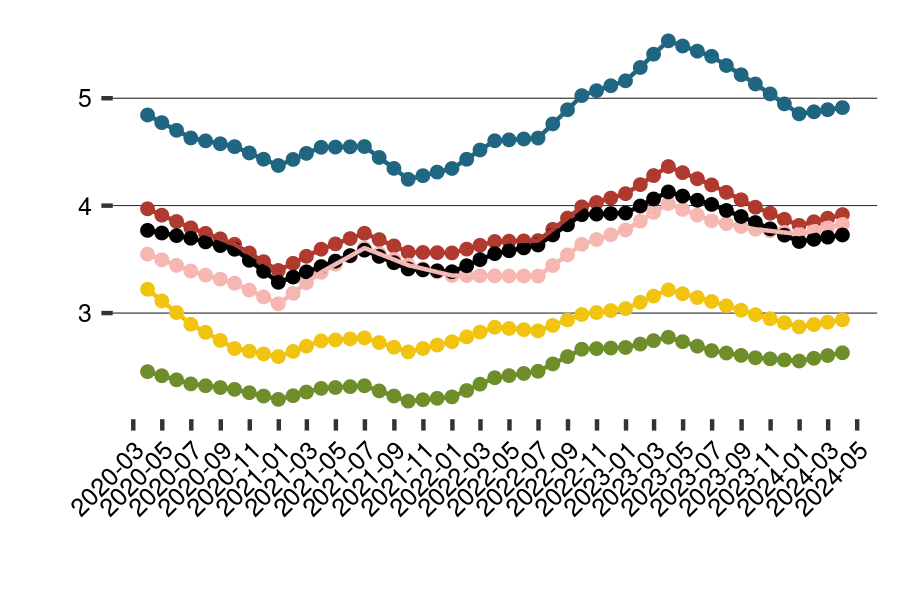
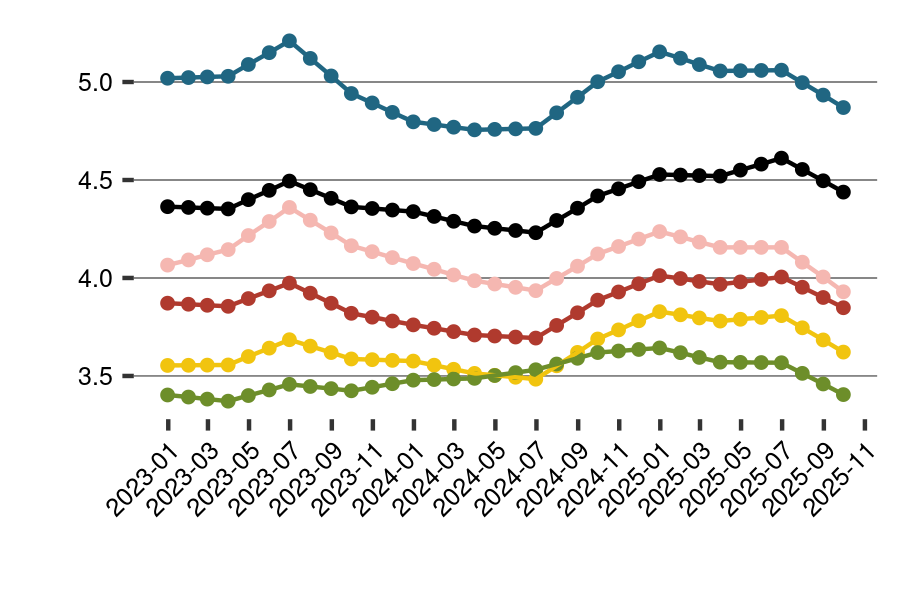
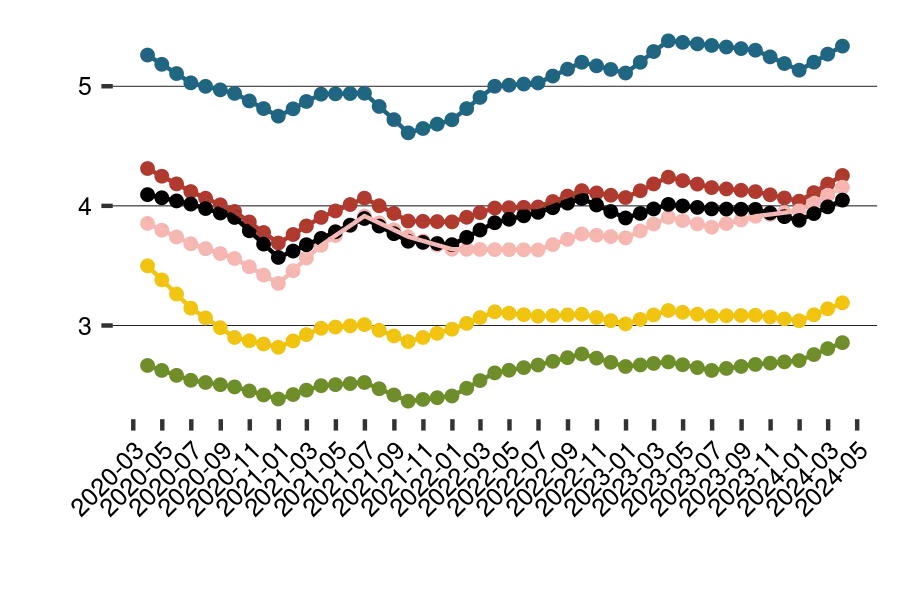
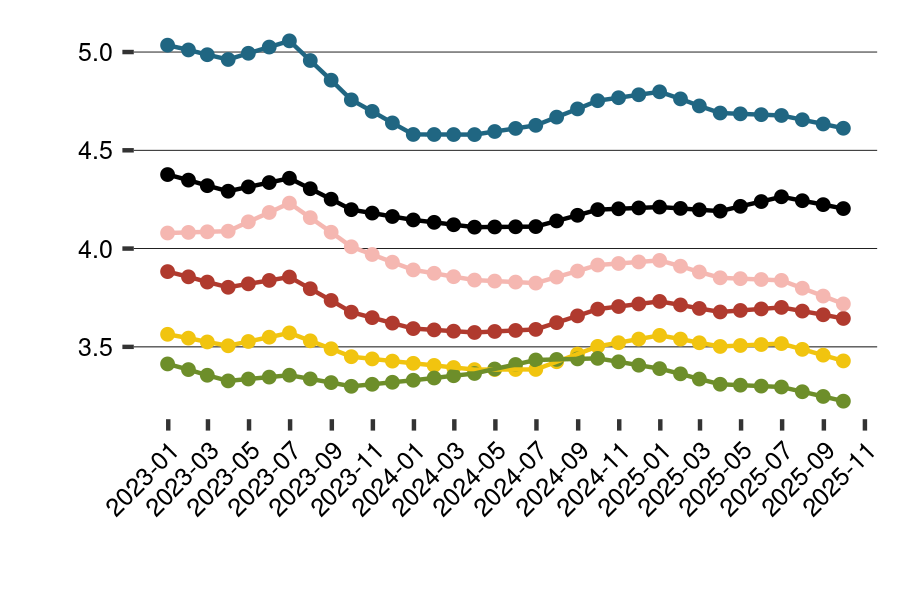
Development of EBITC Multiples over time (6-25 employees)
⬤ Software / IT-Services ⬤ Manufacturing industry ⬤ Services ⬤ Gastronomy ⬤ Trade ⬤ Construction / Crafts
🇦🇺 AU | Australia
2-5 employees
Industry
EBITC Multiple
EBIT Multiple
EBITDA Multiple
Sales multiples
Software / IT Services
2
4.3
4.1
1.1
Manufacturing industry
2
3.5
3.3
0.8
Services
1.7
3.2
3.1
0.8
Gastronomy
1.7
3.4
3.2
0.8
Trade
1.7
2.9
2.8
0.5
Craft / Construction
1.4
2.5
2.4
0.6
6-25 employees
Industry
EBITC Multiple
EBIT Multiple
EBITDA Multiple
Sales multiples
Software / IT Services
3.2
5.2
4.9
1.2
Manufacturing industry
3.2
4.3
4
0.8
Services
2.7
3.9
3.7
0.9
Gastronomy
2.6
4.1
3.8
0.8
Trade
2.6
3.5
3.3
0.6
Craft / Construction
2.2
3
2.9
0.6
26-99 employees
Industry
EBITC Multiple
EBIT Multiple
EBITDA Multiple
Sales multiples
Software / IT Services
3.6
5.2
4.8
1
Manufacturing industry
3.6
4.3
3.9
0.7
Services
3.1
3.9
3.7
0.8
Gastronomy
3
4.1
3.7
0.7
Trade
3
3.5
3.3
0.5
Craft / Construction
2.5
3
2.8
0.5
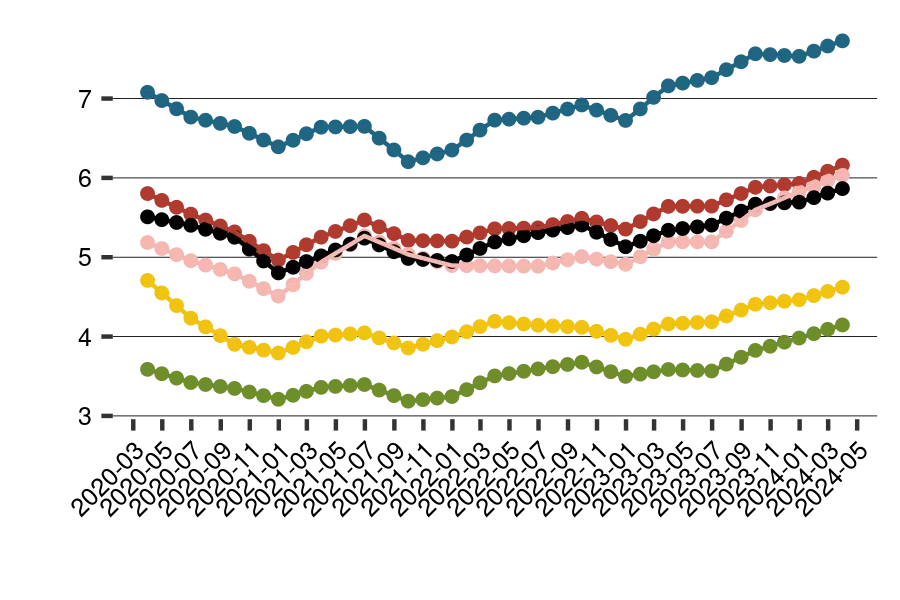
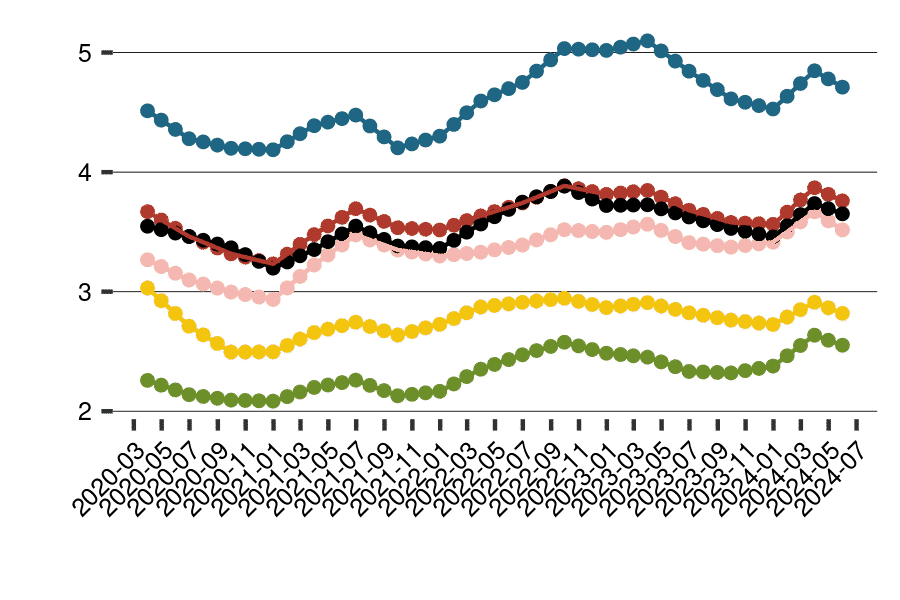
Development of EBITC Multiples over time (6-25 employees)
⬤ Software / IT-Services ⬤ Manufacturing industry ⬤ Services ⬤ Gastronomy ⬤ Trade ⬤ Construction / Crafts
🇧🇷 BR | Brazil
2-5 employees
Industry
EBITC Multiple
EBIT Multiple
EBITDA Multiple
Sales multiples
Software / IT Services
2.6
5.3
5
2
Manufacturing industry
2.6
4.3
4.1
1.4
Services
2.2
4
3.8
1.5
Gastronomy
2.2
4.1
3.9
1.3
Trade
2.2
3.6
3.4
1
Craft / Construction
1.8
3.1
2.9
1
6-25 employees
Industry
EBITC Multiple
EBIT Multiple
EBITDA Multiple
Sales multiples
Software / IT Services
4.1
6.4
6.1
2.1
Manufacturing industry
4.1
5.2
5
1.5
Services
3.5
4.8
4.6
1.5
Gastronomy
3.4
5
4.8
1.4
Trade
3.4
4.3
4.1
1
Craft / Construction
2.8
3.7
3.5
1
26-99 employees
Industry
EBITC Multiple
EBIT Multiple
EBITDA Multiple
Sales multiples
Software / IT Services
4.7
6.4
6.1
1.8
Manufacturing industry
4.7
5.3
5
1.3
Services
3.9
4.8
4.6
1.3
Gastronomy
3.9
5.1
4.7
1.2
Trade
3.9
4.4
4.1
0.9
Craft / Construction
3.2
3.7
3.5
0.9
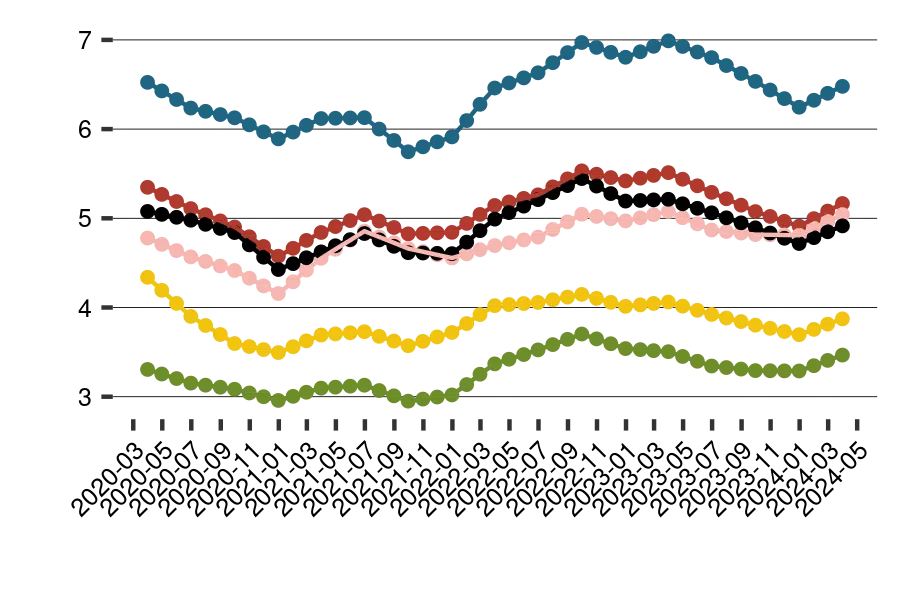
Development of EBITC Multiples over time (6-25 employees)
⬤ Software / IT-Services ⬤ Manufacturing industry ⬤ Services ⬤ Gastronomy ⬤ Trade ⬤ Construction / Crafts
🇨🇦 CA | Canada
2-5 employees
Industry
EBITC Multiple
EBIT Multiple
EBITDA Multiple
Sales multiples
Software / IT Services
2.6
4.9
4.6
1.3
Manufacturing industry
2.6
4
3.8
0.9
Services
2.2
3.7
3.5
1
Gastronomy
2.2
3.8
3.6
0.9
Trade
2.2
3.3
3.1
0.6
Craft / Construction
1.8
2.8
2.7
0.7
6-25 employees
Industry
EBITC Multiple
EBIT Multiple
EBITDA Multiple
Sales multiples
Software / IT Services
4.1
5.9
5.6
1.4
Manufacturing industry
4.1
4.8
4.6
1
Services
3.5
4.4
4.2
1
Gastronomy
3.4
4.6
4.4
0.9
Trade
3.4
4
3.8
0.7
Craft / Construction
2.8
3.4
3.3
0.7
26-99 employees
Industry
EBITC Multiple
EBIT Multiple
EBITDA Multiple
Sales multiples
Software / IT Services
4.7
5.9
5.6
1.2
Manufacturing industry
4.7
4.9
4.6
0.8
Services
3.9
4.5
4.2
0.9
Gastronomy
3.9
4.7
4.4
0.8
Trade
3.9
4
3.8
0.6
Craft / Construction
3.2
3.4
3.3
0.6
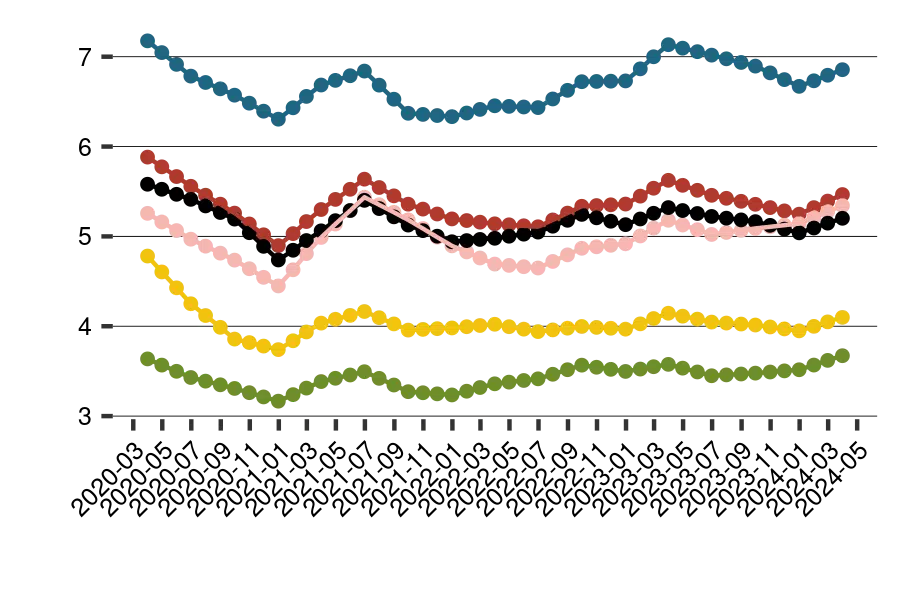
DEVELOPMENT OF EBITC MULTIPLES OVER TIME (6-25 EMPLOYEES)
⬤ Software / IT-Services ⬤ Manufacturing industry ⬤ Services ⬤ Gastronomy ⬤ Trade ⬤ Construction / Crafts
🇨🇭 CH | Switzerland
2-5 employees
Industry
EBITC Multiple
EBIT Multiple
EBITDA Multiple
Sales multiples
Software / IT Services
3.5
8.1
7.6
1.2
Manufacturing industry
3.5
6.6
6.1
0.8
Services
3
6.1
5.7
0.9
Gastronomy
2.9
6.4
5.8
0.8
Trade
2.9
5.5
5.2
0.6
Craft / Construction
2.4
4.7
4.5
0.6
6-25 employees
Industry
EBITC Multiple
EBIT Multiple
EBITDA Multiple
Sales multiples
Software / IT Services
5.5
9.8
9
1.2
Manufacturing industry
5.5
8.1
7.3
0.9
Services
4.6
7.4
6.8
0.9
Gastronomy
4.5
7.7
6.9
0.8
Trade
4.6
6.6
6.2
0.6
Craft / Construction
3.8
5.7
5.3
0.6
26-99 employees
Industry
EBITC Multiple
EBIT Multiple
EBITDA Multiple
Sales multiples
Software / IT Services
6.3
9.9
8.7
1.1
Manufacturing industry
6.3
8.1
7.1
0.8
Services
5.3
7.4
6.6
0.8
Gastronomy
5.2
7.8
6.7
0.7
Trade
5.2
6.7
6.1
0.5
Craft / Construction
4.3
5.7
5.2
0.5
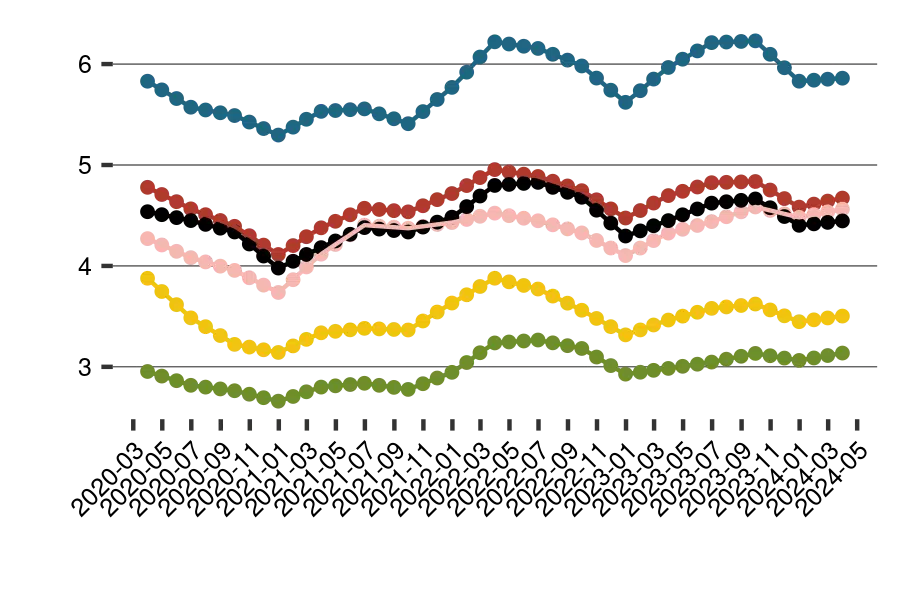
Development of EBITC Multiples over time (6-25 employees)
⬤ Software / IT-Services ⬤ Manufacturing industry ⬤ Services ⬤ Gastronomy ⬤ Trade ⬤ Construction / Crafts
🇩🇪 DE | Germany
2-5 employees
Industry
EBITC Multiple
EBIT Multiple
EBITDA Multiple
Sales multiples
Software / IT Services
2.9
6.1
5.6
1.3
Manufacturing industry
2.9
5
4.6
0.9
Services
2.5
4.6
4.3
1
Gastronomy
2.4
4.8
4.3
0.9
Trade
2.4
4.1
3.9
0.6
Craft / Construction
2
3.5
3.3
0.6
6-25 employees
Industry
EBITC Multiple
EBIT Multiple
EBITDA Multiple
Sales multiples
Software / IT Services
4.6
7.4
6.7
1.4
Manufacturing industry
4.6
6.1
5.4
0.9
Services
3.9
5.6
5.1
1
Gastronomy
3.8
5.8
5.1
0.9
Trade
3.8
5
4.7
0.6
Craft / Construction
3.1
4.3
4
0.7
26-99 employees
Industry
EBITC Multiple
EBIT Multiple
EBITDA Multiple
Sales multiples
Software / IT Services
5.2
7.5
6.5
1.2
Manufacturing industry
5.2
6.1
5.3
0.8
Services
4.4
5.6
4.9
0.9
Gastronomy
4.3
5.8
5
0.8
Trade
4.3
5.1
4.5
0.6
Craft / Construction
3.6
4.3
3.9
0.6
Development of EBITC Multiples over time (6-25 employees)
⬤ Software / IT-Services ⬤ Manufacturing industry ⬤ Services ⬤ Gastronomy ⬤ Trade ⬤ Construction / Crafts
🇪🇸 ES | Spain
2-5 employees
Industry
EBITC Multiple
EBIT Multiple
EBITDA Multiple
Sales multiples
Software / IT Services
4.3
8.3
7.9
2
Manufacturing industry
4.3
6.8
6.5
1.4
Services
3.6
6.3
6
1.5
Gastronomy
3.5
6.6
6.3
1.3
Trade
3.5
5.7
5.4
1
Craft / Construction
3
4.9
4.6
1
6-25 employees
Industry
EBITC Multiple
EBIT Multiple
EBITDA Multiple
Sales multiples
Software / IT Services
6.7
10.1
9.6
2.1
Manufacturing industry
6.7
8.3
7.9
1.5
Services
5.6
7.6
7.2
1.5
Gastronomy
5.5
8
7.6
1.4
Trade
5.5
6.9
6.5
1
Craft / Construction
4.6
5.9
5.6
1
26-99 employees
Industry
EBITC Multiple
EBIT Multiple
EBITDA Multiple
Sales multiples
Software / IT Services
7.6
10.2
9.6
1.8
Manufacturing industry
7.6
8.3
7.8
1.3
Services
6.4
7.7
7.3
1.3
Gastronomy
6.3
8
7.5
1.2
Trade
6.3
6.9
6.6
0.9
Craft / Construction
5.3
5.9
5.6
0.9
Development of EBITC Multiples over time (6-25 employees)
⬤ Software / IT-Services ⬤ Manufacturing industry ⬤ Services ⬤ Gastronomy ⬤ Trade ⬤ Construction / Crafts
🇫🇷 FR | France
2-5 employees
Industry
EBITC Multiple
EBIT Multiple
EBITDA Multiple
Sales multiples
Software / IT Services
3.2
6.4
6.1
1.3
Manufacturing industry
3.2
5.3
5
0.9
Services
2.7
4.8
4.6
1
Gastronomy
2.7
5
4.7
0.9
Trade
2.7
4.3
4.1
0.6
Craft / Construction
2.2
3.7
3.5
0.6
6-25 employees
Industry
EBITC Multiple
EBIT Multiple
EBITDA Multiple
Sales multiples
Software / IT Services
5.1
7.8
7.3
1.3
Manufacturing industry
5.1
6.4
6
0.9
Services
4.3
5.9
5.5
1
Gastronomy
4.2
6.1
5.7
0.9
Trade
4.2
5.3
5
0.6
Craft / Construction
3.5
4.5
4.3
0.7
26-99 employees
Industry
EBITC Multiple
EBIT Multiple
EBITDA Multiple
Sales multiples
Software / IT Services
5.8
7.8
7.1
1.2
Manufacturing industry
5.8
6.4
5.8
0.8
Services
4.9
5.9
5.4
0.9
Gastronomy
4.8
6.1
5.5
0.8
Trade
4.8
5.3
5
0.6
Craft / Construction
4
4.5
4.3
0.6
Development of EBITC Multiples over time (6-25 employees)
⬤ Software / IT-Services ⬤ Manufacturing industry ⬤ Services ⬤ Gastronomy ⬤ Trade ⬤ Construction / Crafts
🇮🇹 IT | Italy
2-5 employees
Industry
EBITC Multiple
EBIT Multiple
EBITDA Multiple
Sales multiples
Software / IT Services
4.7
7.7
4.3
1.3
Manufacturing industry
4.1
6
3.8
0.9
Services
3.8
6.1
3.7
1
Gastronomy
3.9
6.1
3.4
0.8
Trade
3.4
5.4
3.4
0.6
Craft / Construction
3.2
4.8
3.2
0.7
6-25 employees
Industry
EBITC Multiple
EBIT Multiple
EBITDA Multiple
Sales multiples
Software / IT Services
6.6
9.3
6.8
1.4
Manufacturing industry
5.8
7.3
6
1
Services
5.4
7.4
5.8
1.1
Gastronomy
5.5
7.4
5.3
0.9
Trade
4.8
6.5
5.4
0.6
Craft / Construction
4.5
5.9
4.9
0.8
26-99 employees
Industry
EBITC Multiple
EBIT Multiple
EBITDA Multiple
Sales multiples
Software / IT Services
7.8
9.6
7.9
1.3
Manufacturing industry
6.9
7.6
7
1
Services
6.4
7.7
6.7
1
Gastronomy
6.6
7.6
6.2
0.9
Trade
5.7
6.7
6.2
0.6
Craft / Construction
5.4
6.1
5.7
0.7
DEVELOPMENT OF EBITC MULTIPLES OVER TIME (6-25 EMPLOYEES)
⬤ Software / IT-Services ⬤ Manufacturing industry ⬤ Services ⬤ Gastronomy ⬤ Trade ⬤ Construction / Crafts
🇲🇽 MX | Mexico
2-5 employees
Industry
EBITC Multiple
EBIT Multiple
EBITDA Multiple
Sales multiples
Software / IT Services
2.8
4.8
4.6
2
Manufacturing industry
2.8
4
3.8
1.4
Services
2.3
3.6
3.5
1.5
Gastronomy
2.3
3.8
3.6
1.3
Trade
2.3
3.3
3.1
0.9
Craft / Construction
1.9
2.8
2.7
1
6-25 employees
Industry
EBITC Multiple
EBIT Multiple
EBITDA Multiple
Sales multiples
Software / IT Services
4.3
5.9
5.6
2.1
Manufacturing industry
4.3
4.8
4.6
1.5
Services
3.6
4.4
4.2
1.5
Gastronomy
3.6
4.6
4.4
1.4
Trade
3.6
4
3.8
1
Craft / Construction
3
3.4
3.2
1
26-99 employees
Industry
EBITC Multiple
EBIT Multiple
EBITDA Multiple
Sales multiples
Software / IT Services
4.9
5.9
5.6
1.8
Manufacturing industry
4.9
4.9
4.6
1.3
Services
4.2
4.4
4.2
1.3
Gastronomy
4.1
4.6
4.4
1.2
Trade
4.1
4
3.8
0.8
Craft / Construction
3.4
3.4
3.3
0.9
DEVELOPMENT OF EBITC MULTIPLES OVER TIME (6-25 EMPLOYEES)
⬤ Software / IT-Services ⬤ Manufacturing industry ⬤ Services ⬤ Gastronomy ⬤ Trade ⬤ Construction / Crafts
🇳🇴 NO | Norway
2-5 employees
Industry
EBITC Multiple
EBIT Multiple
EBITDA Multiple
Sales multiples
Software / IT Services
2.3
4.8
4.5
1
Manufacturing industry
2.3
3.9
3.7
0.7
Services
1.9
3.6
3.4
0.8
Gastronomy
1.9
3.7
3.5
0.7
Trade
1.9
3.2
3.1
0.5
Craft / Construction
1.6
2.8
2.6
0.5
6-25 employees
Industry
EBITC Multiple
EBIT Multiple
EBITDA Multiple
Sales multiples
Software / IT Services
3.6
5.8
5.5
1.1
Manufacturing industry
3.6
4.8
4.5
0.7
Services
3
4.4
4.1
0.8
Gastronomy
2.9
4.5
4.2
0.7
Trade
3
3.9
3.7
0.5
Craft / Construction
2.5
3.4
3.2
0.5
26-99 employees
Industry
EBITC Multiple
EBIT Multiple
EBITDA Multiple
Sales multiples
Software / IT Services
4.1
5.8
5.4
0.9
Manufacturing industry
4.1
4.8
4.3
0.6
Services
3.4
4.4
4.1
0.7
Gastronomy
3.4
4.6
4.1
0.6
Trade
3.4
3.9
3.7
0.4
Craft / Construction
2.8
3.4
3.2
0.5
DEVELOPMENT OF EBITC MULTIPLES OVER TIME (6-25 EMPLOYEES)
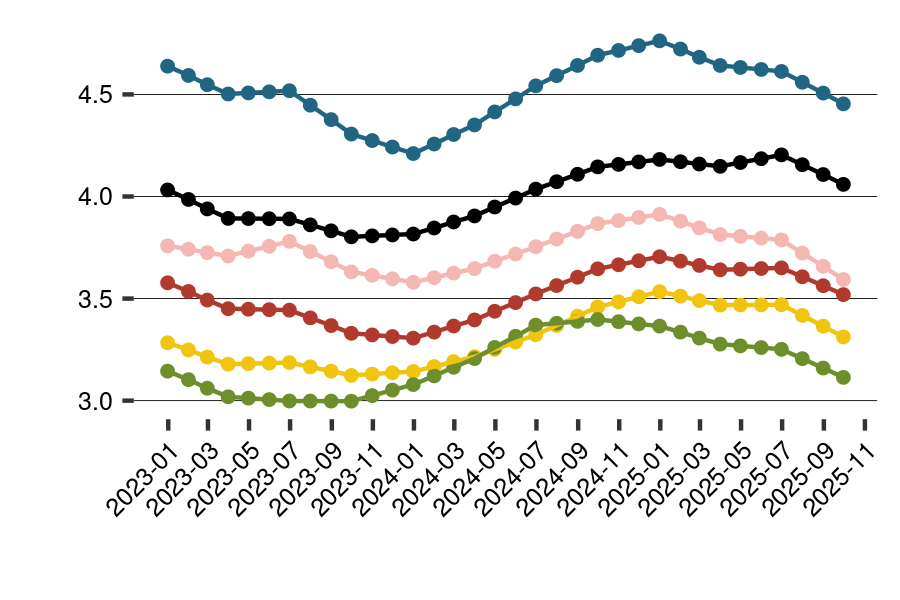
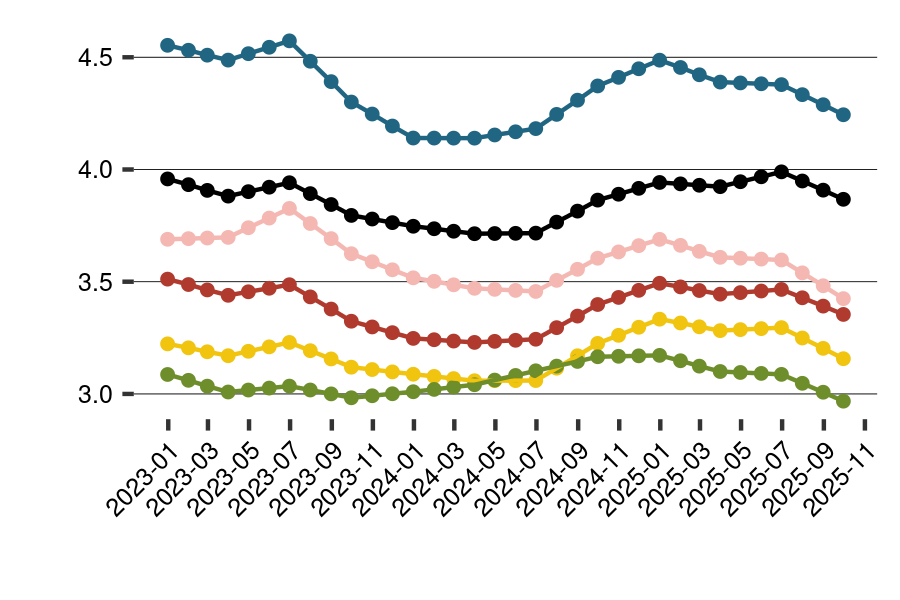
⬤ Software / IT-Services ⬤ Manufacturing industry ⬤ Services ⬤ Gastronomy ⬤ Trade ⬤ Construction / Crafts
🇵🇱 PL | Poland
2-5 employees
Industry
EBITC Multiple
EBIT Multiple
EBITDA Multiple
Sales multiples
Software / IT Services
3.1
6.3
5.9
1.9
Manufacturing industry
3.2
5.2
4.9
1.3
Services
2.6
4.7
4.5
1.4
Gastronomy
2.6
4.9
4.6
1.2
Trade
2.6
4.3
4
0.9
Craft / Construction
2.2
3.6
3.5
0.9
6-25 employees
Industry
EBITC Multiple
EBIT Multiple
EBITDA Multiple
Sales multiples
Software / IT Services
4.9
7.6
7.1
1.9
Manufacturing industry
4.9
6.3
5.8
1.3
Services
4.1
5.7
5.4
1.4
Gastronomy
4
6
5.5
1.3
Trade
4.1
5.2
4.9
0.9
Craft / Construction
3.4
4.4
4.2
0.9
26-99 employees
Industry
EBITC Multiple
EBIT Multiple
EBITDA Multiple
Sales multiples
Software / IT Services
5.6
7.7
6.9
1.7
Manufacturing industry
5.6
6.3
5.6
1.2
Services
4.7
5.8
5.3
1.2
Gastronomy
4.6
6
5.3
1.1
Trade
4.7
5.2
4.8
0.8
Craft / Construction
3.9
4.4
4.1
0.8
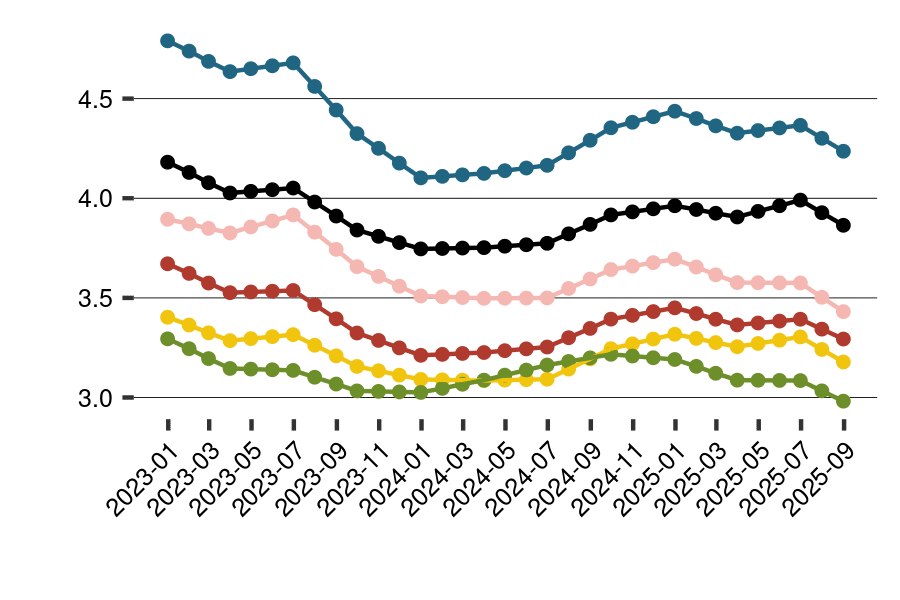
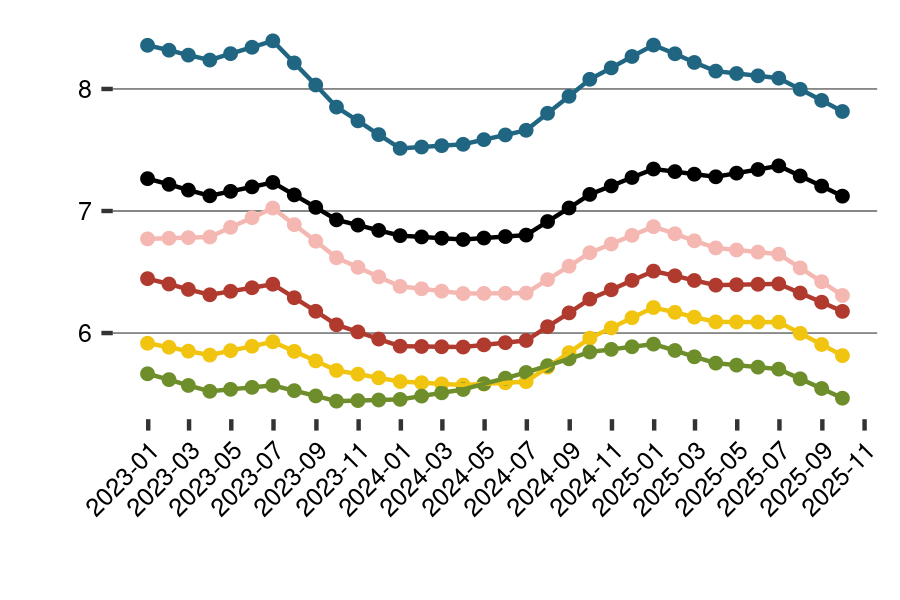
DEVELOPMENT OF EBITC MULTIPLES OVER TIME (6-25 EMPLOYEES)
⬤ Software / IT-Services ⬤ Manufacturing industry ⬤ Services ⬤ Gastronomy ⬤ Trade ⬤ Construction / Crafts
🇵🇹 PT | Portugal
2-5 employees
Industry
EBITC Multiple
EBIT Multiple
EBITDA Multiple
Sales multiples
Software / IT Services
4.2
7.9
7.5
1.9
Manufacturing industry
4.2
6.5
6.2
1.3
Services
3.6
6
5.7
1.4
Gastronomy
3.5
6.2
5.9
1.3
Trade
3.5
5.4
5.1
0.9
Craft / Construction
2.9
4.6
4.4
0.9
6-25 employees
Industry
EBITC Multiple
EBIT Multiple
EBITDA Multiple
Sales multiples
Software / IT Services
6.7
9.6
9.1
2
Manufacturing industry
6.7
7.9
7.4
1.4
Services
5.6
7.2
6.9
1.5
Gastronomy
5.5
7.5
7
1.3
Trade
5.5
6.5
6.2
0.9
Craft / Construction
4.6
5.6
5.3
1
26-99 employees
Industry
EBITC Multiple
EBIT Multiple
EBITDA Multiple
Sales multiples
Software / IT Services
7.6
9.7
8.9
1.7
Manufacturing industry
7.6
7.9
7.2
1.2
Services
6.4
7.3
6.8
1.3
Gastronomy
6.2
7.6
6.8
1.1
Trade
6.3
6.6
6.2
0.8
Craft / Construction
5.2
5.6
5.3
0.8
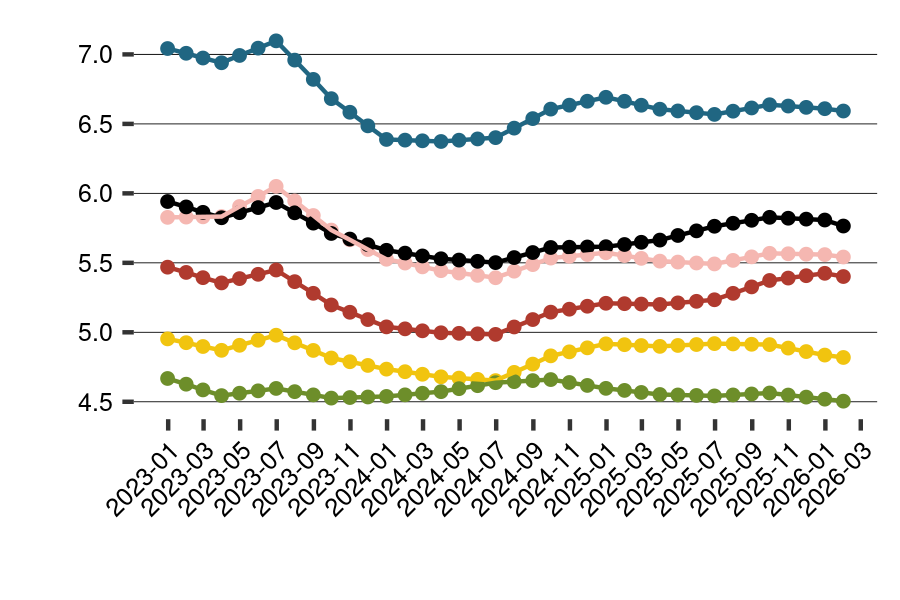
DEVELOPMENT OF EBITC MULTIPLES OVER TIME (6-25 EMPLOYEES)
⬤ Software / IT-Services ⬤ Manufacturing industry ⬤ Services ⬤ Gastronomy ⬤ Trade ⬤ Construction / Crafts
🇬🇧 UK | United Kingdom
2-5 employees
Industry
EBITC Multiple
EBIT Multiple
EBITDA Multiple
Sales multiples
Software / IT Services
3
5.6
5.3
1.6
Manufacturing industry
3
4.6
4.4
1.1
Services
2.5
4.2
4
1.2
Gastronomy
2.5
4.4
4.1
1
Trade
2.5
3.8
3.6
0.7
Craft / Construction
2.1
3.3
3.1
0.8
6-25 employees
Industry
EBITC Multiple
EBIT Multiple
EBITDA Multiple
Sales multiples
Software / IT Services
4.7
6.8
6.4
1.6
Manufacturing industry
4.7
5.6
5.2
1.1
Services
4
5.1
4.9
1.2
Gastronomy
3.9
5.4
4.9
1.1
Trade
3.9
4.6
4.4
0.8
Craft / Construction
3.2
4
3.8
0.8
26-99 employees
Industry
EBITC Multiple
EBIT Multiple
EBITDA Multiple
Sales multiples
Software / IT Services
5.4
6.9
6.2
1.4
Manufacturing industry
5.4
5.6
5
1
Services
4.5
5.2
4.7
1
Gastronomy
4.4
5.4
4.8
0.9
Trade
4.5
4.7
4.3
0.7
Craft / Construction
3.7
4
3.7
0.7
DEVELOPMENT OF EBITC MULTIPLES OVER TIME (6-25 EMPLOYEES)
⬤ Software / IT-Services ⬤ Manufacturing industry ⬤ Services ⬤ Gastronomy ⬤ Trade ⬤ Construction / Crafts
🇸🇪 SE | Sweden
2-5 employees
Industry
EBITC Multiple
EBIT Multiple
EBITDA Multiple
Sales multiples
Software / IT Services
3.8
7.7
7.3
1.2
Manufacturing industry
3.8
6.3
6
0.9
Services
3.2
5.8
5.5
0.9
Gastronomy
3.1
6
5.7
0.8
Trade
3.1
5.2
4.9
0.6
Craft / Construction
2.6
4.5
4.2
0.6
6-25 employees
Industry
EBITC Multiple
EBIT Multiple
EBITDA Multiple
Sales multiples
Software / IT Services
5.9
9.3
8.9
1.3
Manufacturing industry
5.9
7.7
7.3
0.9
Services
5
7
6.7
0.9
Gastronomy
4.9
7.3
7
0.8
Trade
4.9
6.3
6
0.6
Craft / Construction
4.1
5.4
5.1
0.6
26-99 employees
Industry
EBITC Multiple
EBIT Multiple
EBITDA Multiple
Sales multiples
Software / IT Services
6.7
9.4
8.9
1.1
Manufacturing industry
6.7
7.7
7.3
0.8
Services
5.7
7.1
6.7
0.8
Gastronomy
5.6
7.4
7
0.7
Trade
5.6
6.4
6
0.5
Craft / Construction
4.6
5.4
5.2
0.5
Development of EBITC Multiples over time (6-25 employees)
⬤ Software / IT-Services ⬤ Manufacturing industry ⬤ Services ⬤ Gastronomy ⬤ Trade ⬤ Construction / Crafts
🇺🇸 US | United States
2-5 employees
Industry
EBITC Multiple
EBIT Multiple
EBITDA Multiple
Sales multiples
Software / IT Services
2.6
6.3
5.9
1.6
Manufacturing industry
2.6
5.1
4.9
1.1
Services
2.2
4.7
4.5
1.2
Gastronomy
2.1
4.9
4.7
1
Trade
2.2
4.2
4
0.7
Craft / Construction
1.8
3.6
3.4
0.8
6-25 employees
Industry
EBITC Multiple
EBIT Multiple
EBITDA Multiple
Sales multiples
Software / IT Services
4.1
7.6
7.2
1.6
Manufacturing industry
4.1
6.2
5.9
1.1
Services
3.4
5.7
5.4
1.2
Gastronomy
3.4
5.9
5.6
1.1
Trade
3.4
5.1
4.9
0.8
Craft / Construction
2.8
4.4
4.2
0.8
26-99 employees
Industry
EBITC Multiple
EBIT Multiple
EBITDA Multiple
Sales multiples
Software / IT Services
4.7
7.6
7.2
1.4
Manufacturing industry
4.7
6.3
5.9
1
Services
3.9
5.7
5.4
1
Gastronomy
3.8
6
5.6
0.9
Trade
3.9
5.2
4.9
0.7
Craft / Construction
3.2
4.4
4.2
0.7
Development of EBITC Multiples over time (6-25 employees)
⬤ Software / IT-Services ⬤ Manufacturing industry ⬤ Services ⬤ Gastronomy ⬤ Trade ⬤ Construction / Crafts
🇿🇦 ZA | South Africa
2-5 employees
Industry
EBITC Multiple
EBIT Multiple
EBITDA Multiple
Sales multiples
Software / IT Services
2.6
5.7
5.4
1.6
Manufacturing industry
2.6
4.7
4.5
1.1
Services
2.2
4.3
4.1
1.2
Gastronomy
2.1
4.5
4.3
1.1
Trade
2.1
3.9
3.7
0.8
Craft / Construction
1.8
3.3
3.2
0.8
6-25 employees
Industry
EBITC Multiple
EBIT Multiple
EBITDA Multiple
Sales multiples
Software / IT Services
4
6.9
6.6
1.7
Manufacturing industry
4
5.7
5.4
1.2
Services
3.4
5.2
4.9
1.2
Gastronomy
3.3
5.4
5.2
1.1
Trade
3.3
4.7
4.5
0.8
Craft / Construction
2.8
4
3.8
0.8
26-99 employees
Industry
EBITC Multiple
EBIT Multiple
EBITDA Multiple
Sales multiples
Software / IT Services
4.6
7
6.6
1.4
Manufacturing industry
4.6
5.7
5.4
1
Services
3.9
5.2
5
1.1
Gastronomy
3.8
5.5
5.1
0.9
Trade
3.8
4.7
4.5
0.7
Craft / Construction
3.2
4
3.8
0.7
Development of EBITC Multiples over time (6-25 employees)
⬤ Software / IT-Services ⬤ Manufacturing industry ⬤ Services ⬤ Gastronomy ⬤ Trade ⬤ Construction / Crafts
Explanation
The company valuation using so-called multiples is widely used in practice. The method allows comparison with companies that have already received real purchase offers. The observed purchase prices are considered as a multiple (“Multiple”) of a specific financial key figure of the sold companies, and this multiple can then be applied to the company being valued. Experience shows that the observed multiples differ significantly depending on the industry, company size, and country. The EBITC Multiple is NIMBO’s preferred multiple. Statistical analyses show that it is particularly well-suited for the valuation of small and medium-sized enterprises. We also present the EBIT Multiple, the EBITDA Multiple, and the Revenue Multiple, which are popular in practice.
EBIT Multiple =Purchase Price ⁄ EBIT= Purchase Price ⁄ Earnings Before Interest and Taxes
EBITDA Multiple =Purchase Price ⁄ EBITDA= Purchase Price ⁄ Earnings Before Interest, Taxes, Depreciation, and Amortization
EBITC Multiple =Purchase Price ⁄ EBITC= Purchase Price ⁄ Earnings Before Interest, Taxes, and Managing Director’s Salary
Revenue Multiple =Purchase Price ⁄ Revenue
Calculation example
A company with a revenue of 3,000,000, an EBIT (Earnings Before Taxes and Interest) of 400,000, and depreciation of 40,000 is to be valued using the multiple method. The managing director currently pays himself a salary of 100,000. For the country, industry, and company size, average EBIT Multiples of 6, EBITDA Multiples of 5.5, EBITC Multiples of 4, and Revenue Multiples of 0.9 are currently observed.
Valuation with the EBIT Multiple: EBIT x EBIT Multiple = 400,000 x 6 = 2,400,000
Valuation with the EBITDA Multiple: EBITDA x EBITDA Multiple = (400,000 + 40,000) x 5.5 = 2,420,000
Valuation with the EBITC Multiple: EBITC x EBITC Multiple = (400,000 + 100,000) x 5 = 2,500,000
Valuation using the revenue multiple: Revenue x Revenue Multiple = 3,000,000 x 0.9 = 2,700,000
To calculate the value of equity, financial debt is deducted.
As the example shows, different valuation multiples can lead to different results. There is no universally valid rule for which multiple to use when. One can also calculate the average of several multiples. Multiples related to profit are considered more plausible by many. NIMBO relies on the EBITC Multiple for valuation, as statistical analyses show that this multiple is best for valuing SMEs.
The application of the EBIT, EBITC, EBITDA and sales multiple can lead to significantly different results. How can this be?
The results of the individual multiples differ the more the cost structure deviates from the average cost structure of the comparison group. For example, if the company has higher depreciation – relative to revenue or profit – than the comparison group, a valuation using the EBITDA Multiple leads to a higher valuation than with the EBIT Multiple.
Which multiple should I use to valuation my company?
The EBIT Multiple has the advantage over the EBITDA Multiple that it smooths out past investments through depreciation. If similarly high investments need to be made in the future, the EBIT Multiple is a good basis for valuation.
The EBITDA Multiple is a good basis if no significant investments are to be made in the future. Furthermore, it is not influenced by accounting assumptions regarding depreciation.
The EBITC Multiple has the advantage over the EBIT Multiple that no assumptions need to be made about a market-appropriate managing director’s salary. With EBIT, the managing director’s salary must be adjusted. With EBITC, the profit and the owner’s salary are considered as a total. EBITC also allows for the valuation of companies that, while not making a profit, can pay a salary to the managing director. Using the EBIT Multiple method, such companies would be valued at zero.
If you are not sure which multiple to use, it is recommended to average the methods.
How do the NIMBO valuation multiples for Germany differ from the DUB valuation multiples?
The DUB Multiples are based on a collection of many individual company acquisitions, which are compiled by several M&A partners of Deutsche Unternehmerbörse. The detailed data are calculated using a scientific method after several plausibility checks.
The NIMBO valuation multiples reflect what company owners have received for purchase offers. To do this, we survey thousands of entrepreneurs across several countries every month to find out whether you have received an offer to buy your business. Thanks to NIMBO’s standardized questionnaire and the large amount of data, a large number of industry-independent factors can be taken into account (owner dependencies, market position of the company, cluster risks and several more). This allows for a cleansing of the collected data and shows the development of the valuation multiples over time.
Make the Most of Our Unique Data
Beyond financial data, our valuation tool factors in unique industry drivers, market position, growth potential, and much more.
Get your expert valuation report in just 10 minutes—no registration required!